
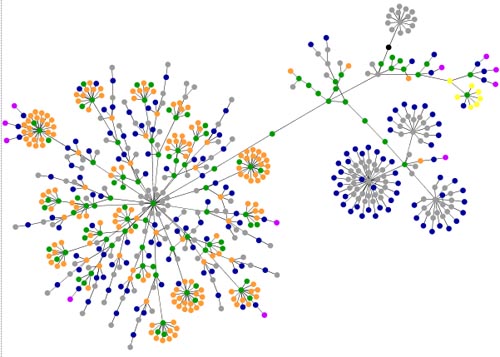
 This image represents the structure of the blog that you are reading (well, technically it has changed since uploading this image, and this blog entry). Confused...? Let me explain. Some guy has written an algorithm that reads the source code of your website, and translates it into an image (check out the site here). The image depicted (click image to enlarge), represents the source code of our blog. In terms of a key, this is what the colours mean:
blue: for links (the A tag)
red: for tables (TABLE, TR and TD tags)
green: for the DIV tag
violet: for images (the IMG tag)
yellow: for forms (FORM, INPUT, TEXTAREA, SELECT and OPTION tags)
orange: for linebreaks and blockquotes (BR, P, and BLOCKQUOTE tags)
black: the HTML tag, the root node
gray: all other tags


No comments:
Post a Comment